Saleor Pulse Overview
Saleor Pulse is the analytics app for your store. It lives inside the Saleor Dashboard and answers the following questions: how sales are trending, whether fulfillment is healthy, which products and customers matter, and what deserves a look right now.
Pulse is built for speed and freshness. After the first import, charts stay near real-time as orders, catalog, and related store activity change. You open it like any other Dashboard surface — not as a separate BI project.
Pulse mounts on the main Dashboard home as a Pulse tab — that is usually the easiest place to open it. You can also open it from Extensions → Installed → Saleor Pulse, and Product Insights appears on product pages.
Create a free Saleor Cloud sandbox, then install Pulse from Extensions → Explore.
Where to Go in Pulse
We aim to organize Pulse around how merchants work — explore the numbers, then notice what matters.
Does this split match how you think about the store? Tell us what lands and what does not — especially if a place is missing, or if Financial / Operations / Attention feel in the wrong order. Share feedback on Discord.
| Place | What it addresses | Ask it when you want to know… |
|---|---|---|
| Financial | Commercial performance for one currency at a time (across all channels using that currency), optionally narrowed to a channel | Are we making money the way we expect, and what is driving it? |
| Operations | Cross-channel operational health | Is fulfillment, cancellation, stock, and order mix healthy? |
| Attention | Insights that surface what matters in your store’s data | What is worth noticing without digging through every chart? |
| Settings | Preferences that shape the views | Timezone, alert preferences, and refresh if numbers look behind |
| Product Insights | One product, on the product page | How is this product selling, and are variants at risk? |
Financial and Operations are the data layer: clear KPIs, trends, and breakdowns you can explore. Attention sits on top of that layer — insights that surface what matters in your store’s data, so you do not have to dig through every chart.
Financial
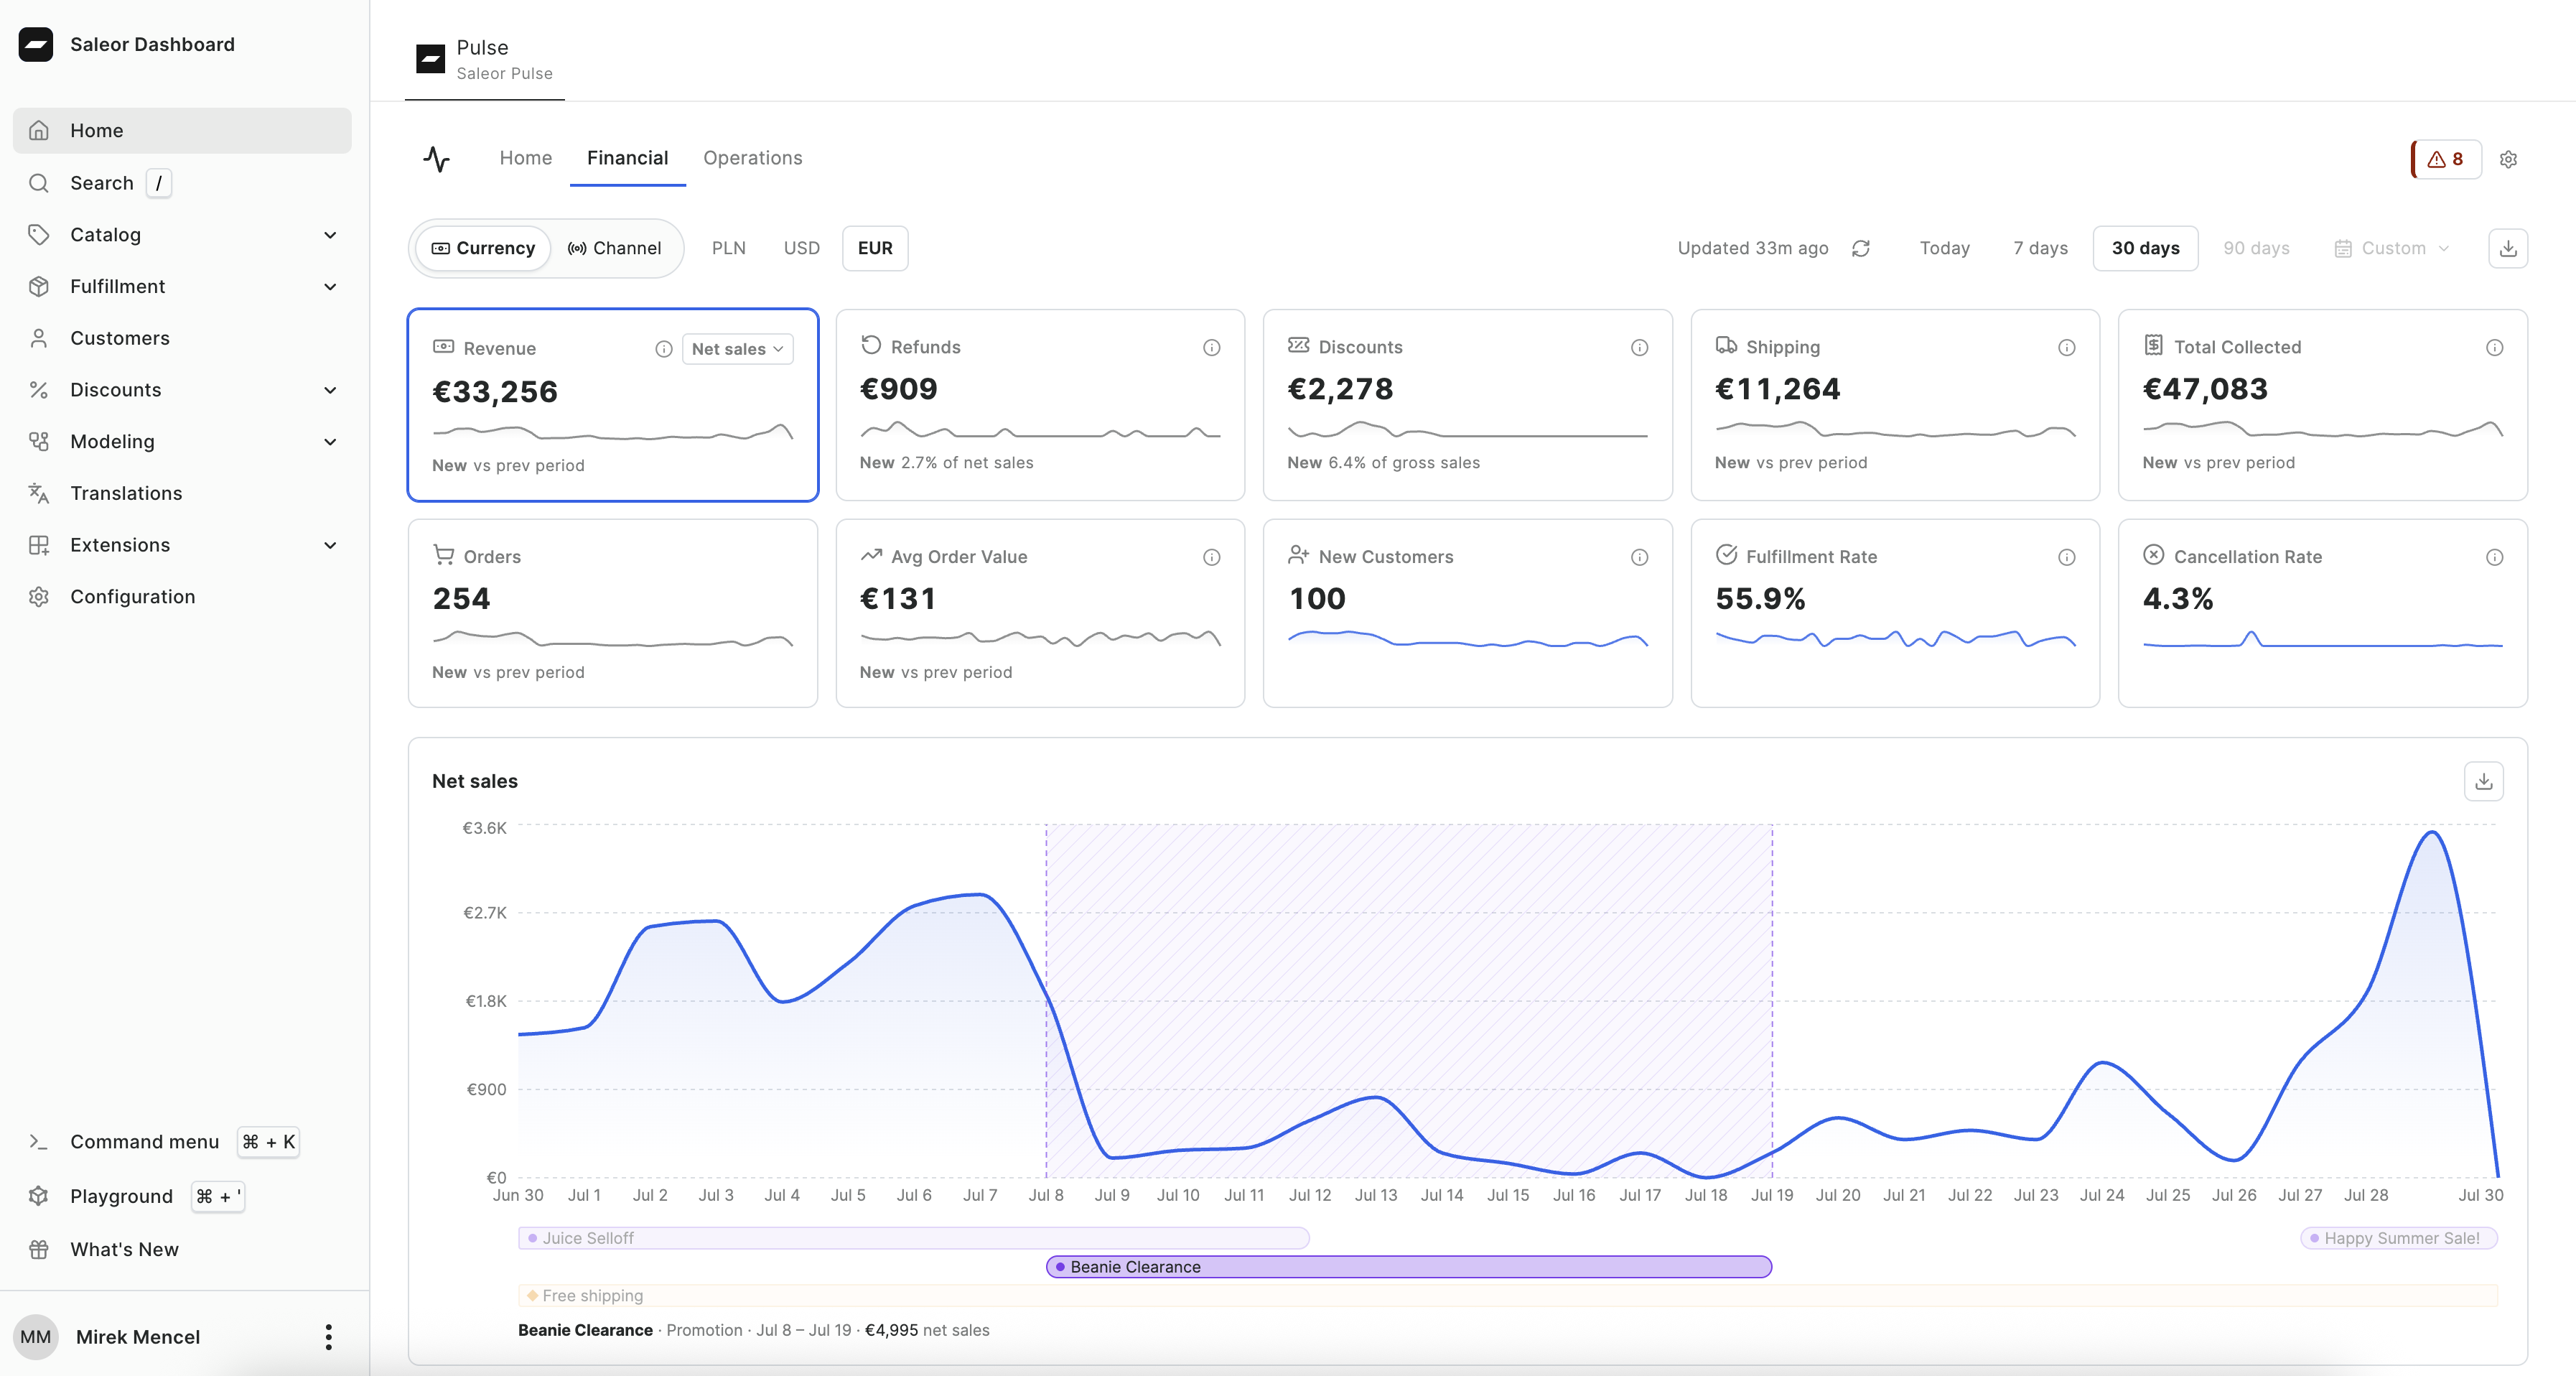
Financial is for commercial performance in one currency at a time (across all channels using that currency). Pick a currency, narrow to a channel when you want storefront-level detail, choose a time window, and work from the KPIs outward.
You get:
- Net sales (with an after-returns view), refunds, discounts, shipping, total collected, orders, average order value, new customers, fulfillment rate, and cancellation rate — each with a sparkline and a period comparison
- A trend for the KPI you care about, with promotions and vouchers on the timeline so a spike has context
- On Today: pace versus yesterday and which promotions are live — more useful than a one-day line chart
- Top products and top customers (customer names and emails need the right staff permission)
- Sales by country (shipping or billing address)
- When orders land during the day
- Named discount attribution when that split helps explain the Discounts KPI
- Origins — surfaces, campaigns, and sources ranked by net after refunds, when orders carry Commerce Context
Use Financial when you are reviewing revenue, comparing periods, or explaining why a number moved.
Operations
Operations is for run-the-store health across channels. You do not pick a currency here — the view is meant to stay useful when you sell in more than one.
You get:
- Fulfillment rate, cancellation rate, average fulfillment hours, and refund rate
- Order volume by channel and order status mix
- Zero-total order rate
- Orders by country and net sales by currency at a glance
- New versus returning buyers over time
- Variants that look at risk of stocking out
Use Operations when you care about fulfillment, cancellations, stock risk, or mix — not about a single currency P&L.
Attention
Attention is where Pulse turns your store’s analytics into timely insights: helpful signals merchants can act on, not another wall of charts.
It sits above Financial and Operations. Those tabs let you explore; Attention highlights what is worth your time.
Today that includes:
- Operational alerts you can tune in Settings — for example zero-total order spikes, cancellation spikes, and unpaid fulfillments — with severity, sample orders, and dismiss when handled
- Worth noting cues such as a record order day, a shift in new versus returning mix, a change in top shipping country, or a product that went quiet or came back after a gap
Open Attention when you want the store to surface issues and notable shifts before you hunt for them.
Product Insights
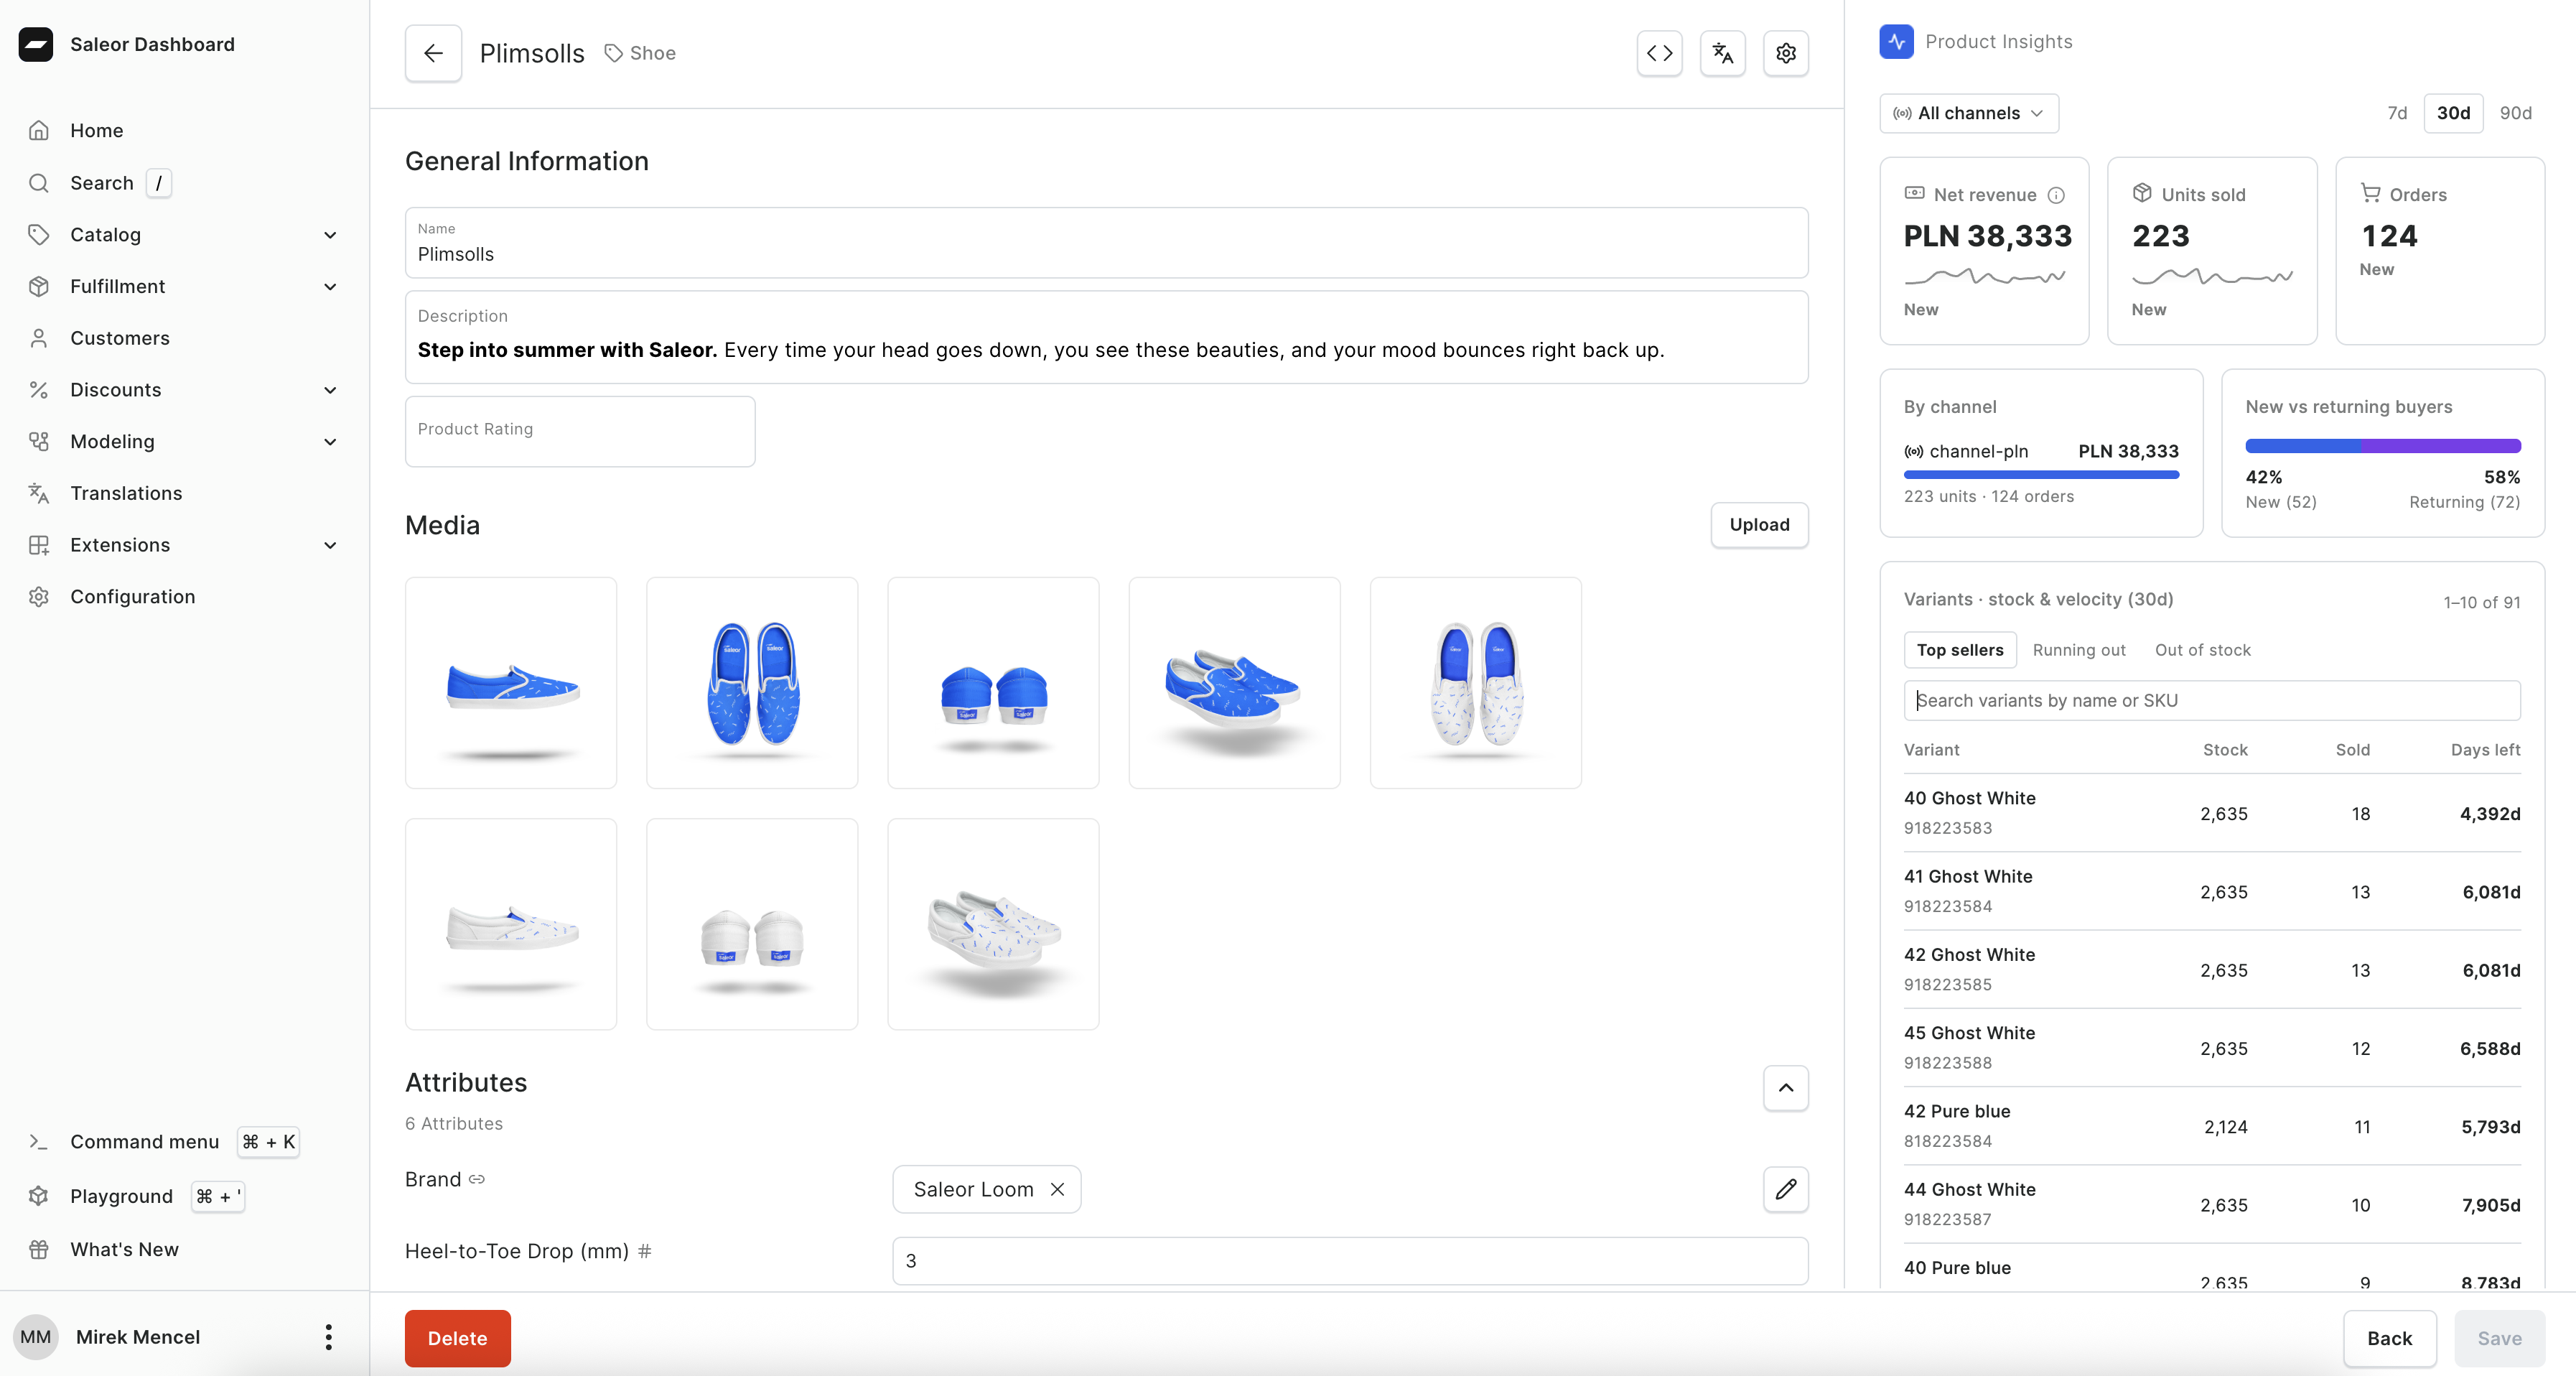
On a product page, Product Insights answers product questions without leaving the catalog.
You get revenue, units, and orders for that product; a channel split when you are looking across channels; new versus returning buyers; and variant-level stock and sell-through context.
Shared Controls
Across Financial and Operations you can:
- Switch time windows: Today, 7 days, 30 days, 90 days, or a custom range
- On Financial: pick a currency (across channels using that currency), and optionally narrow to a channel
- See how fresh the data is and refresh
- Export widgets as CSV or JSON (Top Customers defaults to customer IDs; names and emails are an explicit opt-in per download)
The first time you open Pulse after install, it imports your store history so you do not land on empty zeros. See Configuration.
Assumptions and Limitations
- Pulse analytics cover Saleor commerce data: orders, catalog, customers, fulfillment, and promotions. It does not replace session analytics, ads platforms, or storefront traffic tools.
- How far back you can look depends on your plan. Sandbox keeps a shorter history; Production supports longer windows and custom ranges.
- Financial is one currency at a time (across all channels using that currency). Operations spans currencies.
- Staff permissions control who sees customer identity, Product Insights, and who can change Settings. Details are in Configuration.
Next Steps
- Try Pulse on Saleor Cloud — free sandbox, then install from Extensions → Explore
- Install and configure Pulse
- How Pulse handles customer data
- Commerce Context — write an origin note so Origins can fill